

Correlation patterns at the asset class level stem from two sources, that is discounting factors and the way sectors and industry groups absorb higher or lower interest rates based on their respective impacts on earnings and company cost structures. Interest rates, on the other hand, result from a combination of perceived macro and micro credit risk and overall inflation expectations. Math essentially governs the first part through the time value of money; collective investor attitudes towards risk and return, largely patterned according to the Wave Principle, generally govern the second part. In general what tends to happen is that there is always a winner asset class, a loser asset class and a somewhere-in-between asset class. This is not what we currently see AT ALL and we believe it is reason for at least short-term concern.
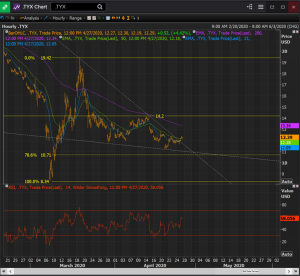
A look at the 30 year yield chart above will reveal a few interesting things. First off, the rally from 83 bp to 1.942% is a bit leaner than the chop lower from 1.942% to 1.100%. The repel at the purple / longer moving average did lead to a cross over in the shorter MAs though not much follow through to the downside could be seen from that situation. Finally, the resistance line of the past month’s descent is much steeper than the corresponding support line of the same move. This suggests that for all the central bank intervention the bond market rally attempt isn’t the strongest. The yields are having difficulty moving any lower.
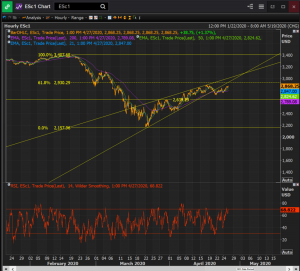
Meanwhile the SP 500 index appears engaged in a sluggish, technically selective push higher. The support line looks steeper than the resistance line, near-term momentum is overbought and the rise is for the most part supported by 5 stocks at this point. It begs the question, if the stock market isn’t yet on strong enough footing to rally in a more meaningful way, why are the bonds – as per the previous chart – looking vulnerable too?
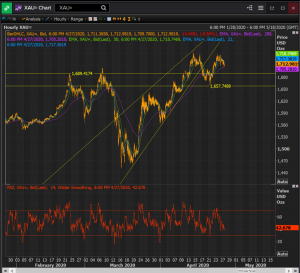
Finally, a similar picture is to be seen in Gold. Here too support lines are steeper than resistance lines coming off the march lows. Here too near-term momentum appears a bit overdone; and here too initial tests of the longer average did not really lead to the meaningful, sustained advances above the shorter averages we’d normally get.
I am not going to bother anybody with our wave counts in SP500, bonds and metals because that may be a bit too technical. Needless to say, they’re all aligned suggesting the risk right now is both paper and hard asset vulnerability; this is compatible with the basic trend analysis explained above. Based on this, we aren’t convinced at all the moment of huge opportunity to deploy may have occurred a few weeks ago, in fact our stance right now is very defensive and we will require either substantially improved valuations, more friendly technicals or a combination of both before we commit to anything. Fundamentally, we believe it is largely under-appreciated how severe the next wave of defaults could end up being; and make no mistake about it, there is a limit to which all these things can end up on Central Bank balance sheets and not become systemic threats at the same time. To conclude, in the face of seemingly abnormal relationships between asset classes, we remain largely skeptical that the markets and the economy will have seen the entire amount of damage there is from the coronavirus crisis.