
Asset price patterns unfold in cycles of definite number and form that have specific technical, mass psychological and fundamental traits.
In The Elliott Wave Principle — A Critical Appraisal, Hamilton Bolton made this opening statement:
As we have advanced through some of the most unpredictable economic climate imaginable, covering depression, major war, and postwar reconstruction and boom, I have noted how well Elliott’s Wave Principle has fitted into the facts of life as they have developed, and have accordingly gained more confidence that this Principle has a good quotient of basic value.
The “Wave Principle” is Ralph Nelson Elliott’s discovery that social, or crowd, behavior trends and reverses in recognizable patterns. Using stock market data as his main research tool, Elliott discovered that the ever-changing path of stock market prices reveals a structural design that in turn reflects a basic harmony found in nature. From this discovery, he developed a rational system of market analysis. Elliott isolated thirteen patterns of movement, or “waves,” that recur in market price data and are repetitive in form, but are not necessarily repetitive in time or amplitude. He named, defined and illustrated the patterns. He then described how these structures link together to form larger versions of those same patterns, how they in turn link to form identical patterns of the next larger size, and so on. In a nutshell, then, the Wave Principle is a catalog of price patterns and an explanation of where these forms are likely to occur in the overall path of market development. Elliott’s descriptions constitute a set of empirically derived rules and guidelines for interpreting market action. Elliott claimed predictive value for The Wave Principle, which now bears his name, “The Elliott Wave Principle.”
Critics always suggest that if the Wave Principle was indeed the mechanism governing markets then its application would yield definite conclusions that are always correct. For starters, it would be easy to point out the same could be said about competing forecasting methods – such as the Efficient Market Hypothesis – whereas empirical evidence also suggests a less-than-perfect forecasting track record (that criticism, however, somehow escapes the serious debates regarding the nature of markets where the negative focus is always on the behavioral approach).
The reality is that, for sound biological reasons (the triune nature of the human brain) Elliott Wave is, first and foremost, a description of mass human - or social - behavior. To start the journey of discovering what may or may not be happening in reality, you can empirically watch financial markets; at times you will wonder where is that rationality the EMH talks about?
There are two points here:
First off, any forecasting method we could ever employ is probabilistic in nature. Forecasting methods pertaining to statistical inference are actually based on sound scientific mathematical and statistical models and are still probabilistic in nature;
Secondly, as Robert Prechter, Jr. suggested, a market will do anything it wants to do though it will do so in an Elliott Wave sequence. The patterns of definite form and number can unfold and link with each other in the context of infinite quantitative variation and our suggestion is that in order to further increase the chances of success with the Wave Principle a quantitative method must be employed side-by-side with the model.
Indeed, the Wave Principle, like any other forecasting tool, is likely to yield errors of judgment more often than not if used in isolation. That does not change the fact that, conceptually, the method is indeed the most accurate description of market behavior and has immense forecasting potential – IF used correctly. As to why that may be the case, that is a discussion for another time.
The diagram below presents an idealized Elliott Wave sequence. Fortunately or not, the real life examples from markets look very different, i.e. much harder to read. But the points to illustrate are these:
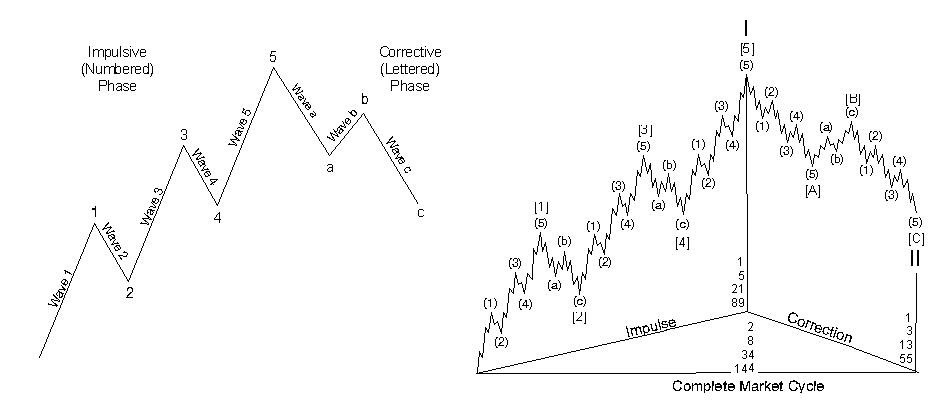
Trend-defining market movements as well as counter-trend market movements unfold in patterns of definite form;
The trend-defining as well as counter-trend patterns are of definite number;
Such patterns link between themselves to form self-similar patterns of higher hierarchical size or degree.
Login Correlation patterns at the asset class level stem from two sources, that is discounting factors and the way sectors and industry groups absorb higher or lower interest rates based on […] The wave principle is unique in the perspective it can give on market trends. Many technicians find themselves confused with Elliott and present as criticism the subjective nature of wave […]
Login or Register for more posts.

Diverging realities
22 May, 2020
0

The decoupling
27 April, 2020
0

Shivers on the back ….
02 April, 2020
0