Fluctuations in correlation patterns between related markets hint at cohesive or fractured markets and are thus important predictors of trends and trend changes alike.
Relative strength analysis is a branch of technical analysis that examines the correlations between – and the relative return potential amongst – related or unrelated markets. Traditionally, relative strength analysis was conducted to isolate the performance of competing asset classes – i.e. stocks, bonds, currencies and commodities – during the inflationary and deflationary phases of the business and market cycles.
The counter-cyclical nature of markets meant that when some asset classes were improving, others were simply naturally losing ground. For instance, during a phase of economic expansion stock prices would go up and push the interest rates higher with them which in turn would depress bond prices. If yields were rising, so was the currency – which in turn would depress commodities. The reverse would also hold true: if stocks fell the economy would struggle, then the interest rates would start falling which in turn would push bond prices up. Falling yields would also put downward pressure on the currency which would instead lead to higher commodity prices.
In addition to this obvious counter-cyclical behaviour of asset classes, sectors within asset classes were prone to out or underperform their peers depending on how situations of rising or falling interest rates or rising or falling currencies would impact the biggest players within such sectors. The growth / defensive question at the sector and industry level was in many ways tied to the stocks / bonds question at the asset mix level.
Furthermore, if market action is viewed as the result of multiple fundamental forces acting simultaneously then the correlation of traditionally uncorrelated markets as well as the lack of correlation of traditionally strong correlated markets must be an omen – and indeed it has historically been. A few examples come to mind: in early 2008 a new sharp high in crude oil went unconfirmed by the Canadian Dollar. Both markets subsequently turned down hard during the 2008-2009 recession. In 2010-2011 the traditionally inverse relationship between stocks and bond prices broke down and was not to be restored until the termination of the QE program.
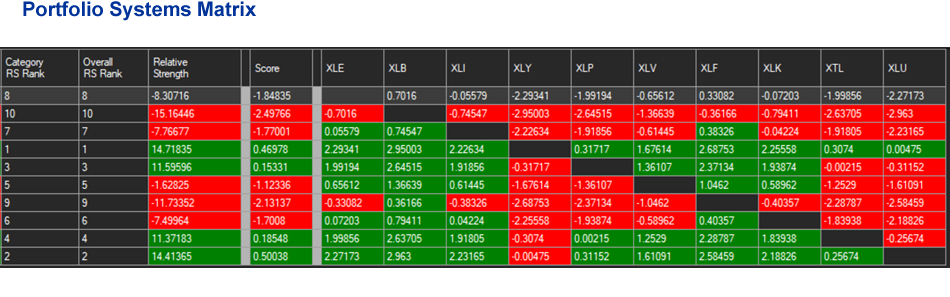
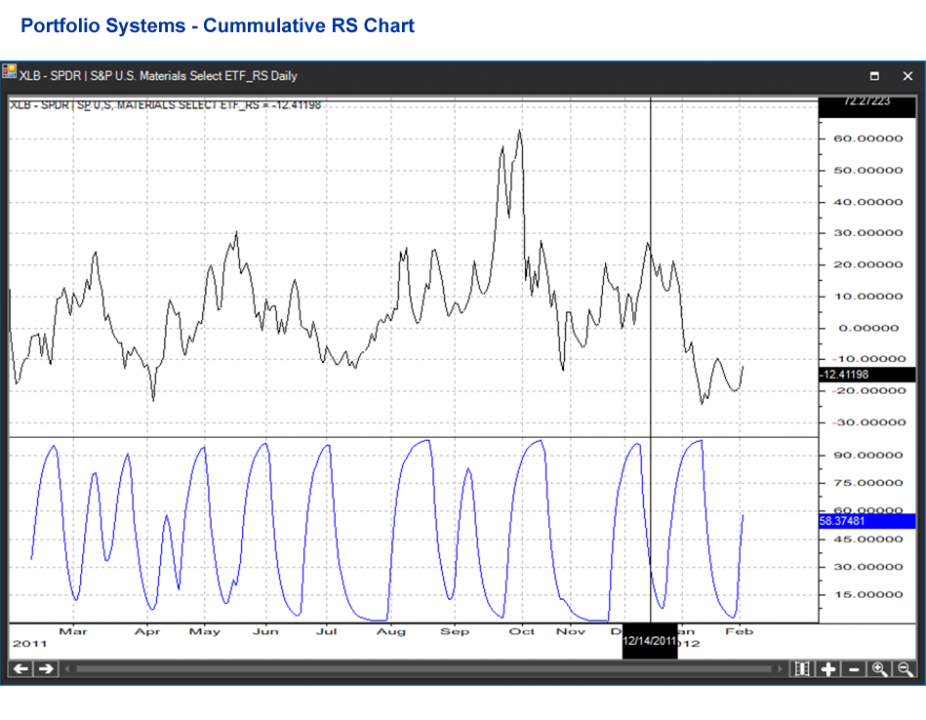
ST Global is very strong in the field of relative strength analysis. Our very own proprietary software takes relative strength analysis to a whole new dimension with the help of the matrix-driven portfolio systems as well as the visually appealing relative rotation graphs.