Diverging realities

More than 100 years ago, Charles Dow, the editor and founder of the Wall Street Journal, formulated six key tenets of market behavior. Dow didn’t mean these observations to form a coherent theory or, let alone, the basis for an evolving field of study; but as it came out, the six key tenets were so important to the study of markets that they got to be called the “Dow Theory” and ultimately ended up forming the very foundation of what today is known as the field of technical analysis – or analysis of market behavior.


Two of the Dow Theory tenets are:

Averages must confirm each other

Dow suggested that if an economy functioned well and a stock market was robust then the Industrials and the Transportation averages should move in sync – on the premise that if the economy was firing on all pistons goods are both produced and transported.


Volume must confirm the trend

The flow of money in and out of the stock market must confirm the direction in which the market is headed. An advance developing on expanding volume – and in the case of futures contracts, on expanding open interest – is a very different development from an advance developing on declining volume or declining open interest. The basic idea is that if the trend is strong enough to continue, it must be able to generate trading interest in its direction.


Interestingly but not surprisingly, the entire field of technical analysis evolved to place an unusual level of importance on the principle of confirmation and divergence. Technicians continuously scrutinize markets, sectors and industries to understand how breadth and flow confirm the trend or fail to do so; how related sectors and industries confirm each other or not; how different styles (growth, value, dividend) and sizes (mega, large, mid, small, micro-cap) perform relative to each other; how new price extremes deliver momentum confirmations or momentum non-confirmations. We do not do these things just to look fancy or pretend we work. Ultimately, these numbers and indicators reflect the balance of supply and demand for certain financial assets as it results from a combination of market fundamentals, availability of return and investor risk appetite. The most important thing to predict future asset prices is understanding the current and the projected state of that supply and demand balance.


I understand and appreciate the fact that a lot of folks believe in the quick turnaround from the pandemic situation. Incoming technical and economic data is not supportive of that at all – in part because it is all diverging.

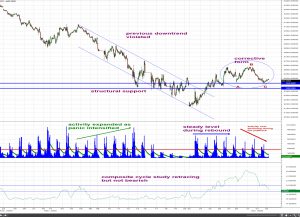
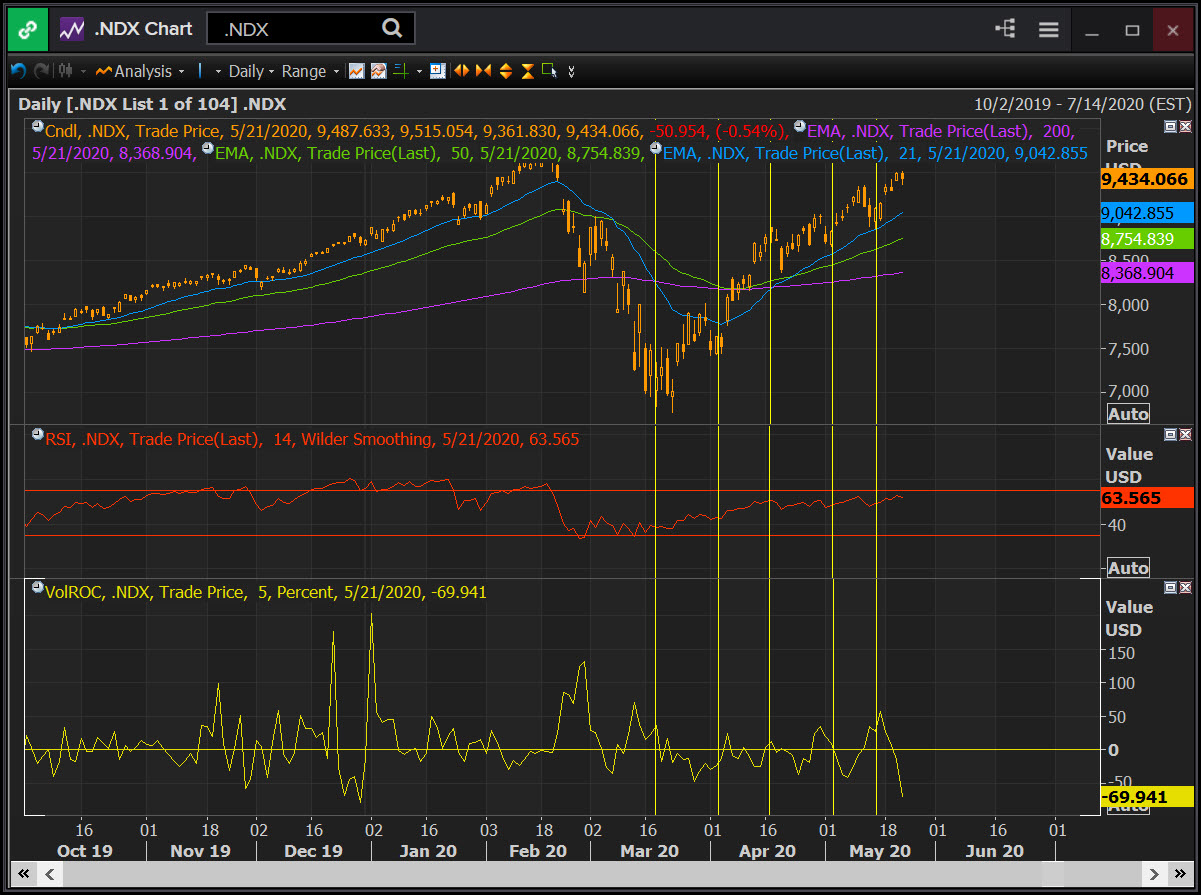
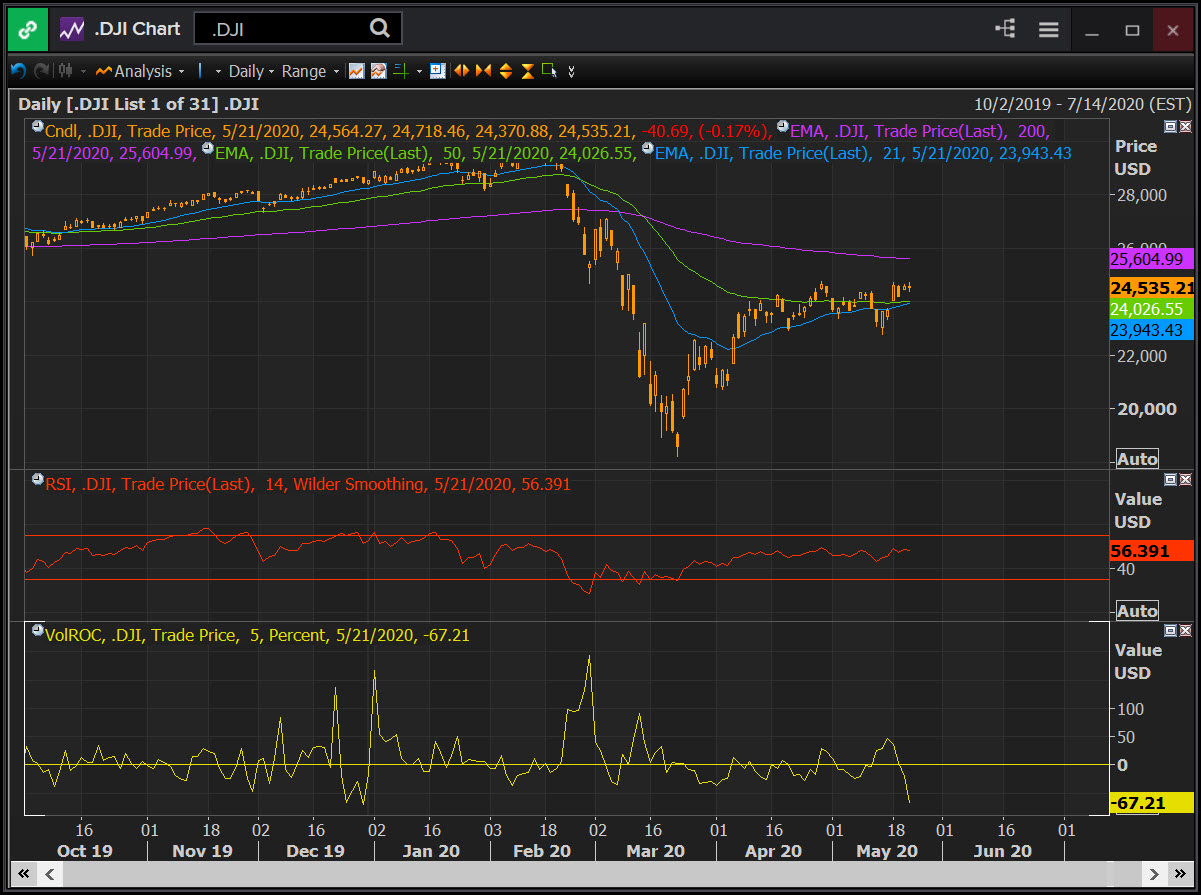
Consider the major indices. The more speculative Nasdaq 100 is approx. 3.7% below its January all time high. Meanwhile the broader S&P 500 and the mega cap Dow Industrials are approx. 13.15 % and 17.07%, respectively, below their corresponding highs. For the Nasdaq 100 and the Dow Industrials, the 5-day Volume rate of change has declined ON EVERY LEG UP since the march lows, suggesting advancing phases are generally occurring on declining volume, a bearish (negative) development.


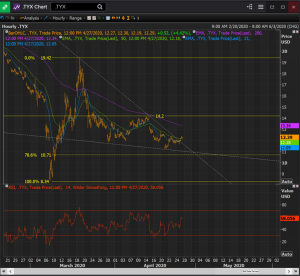
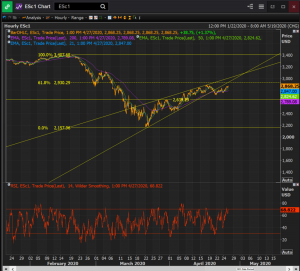
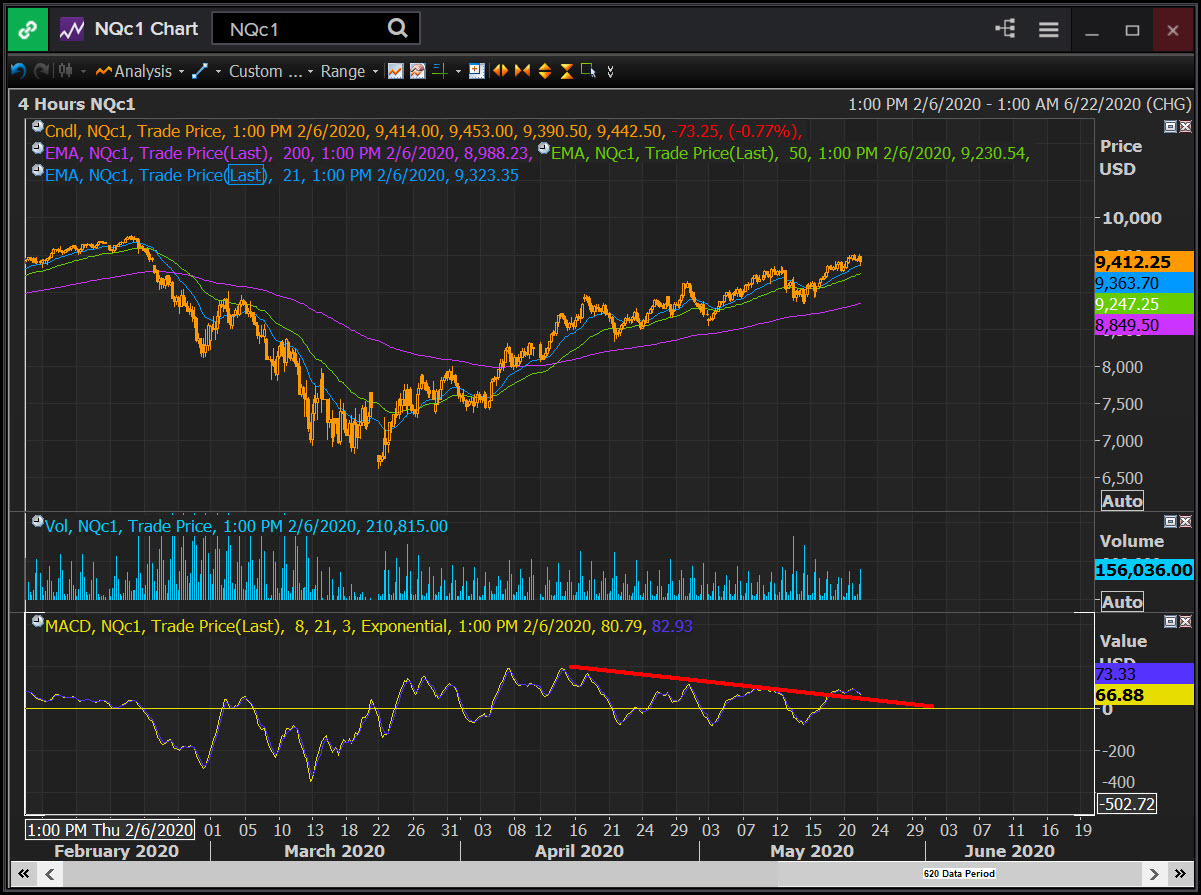
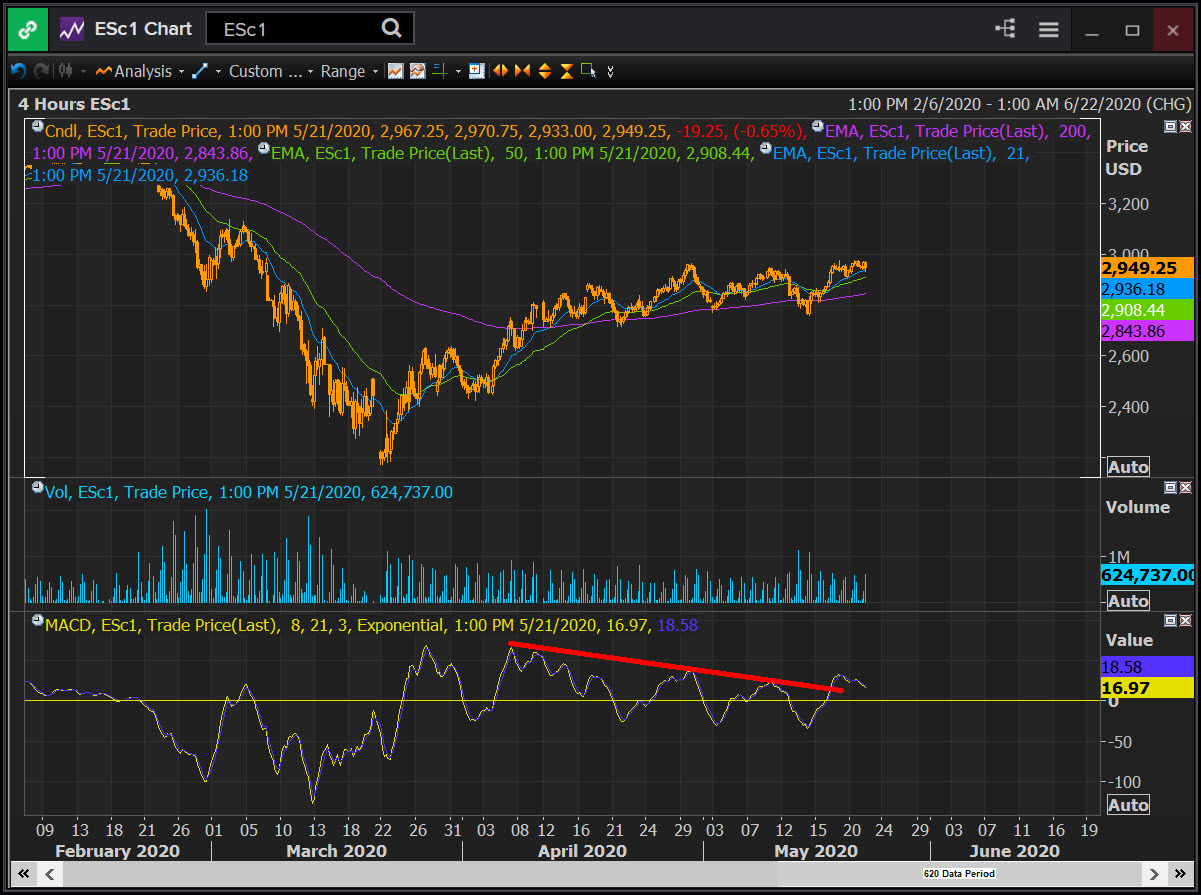
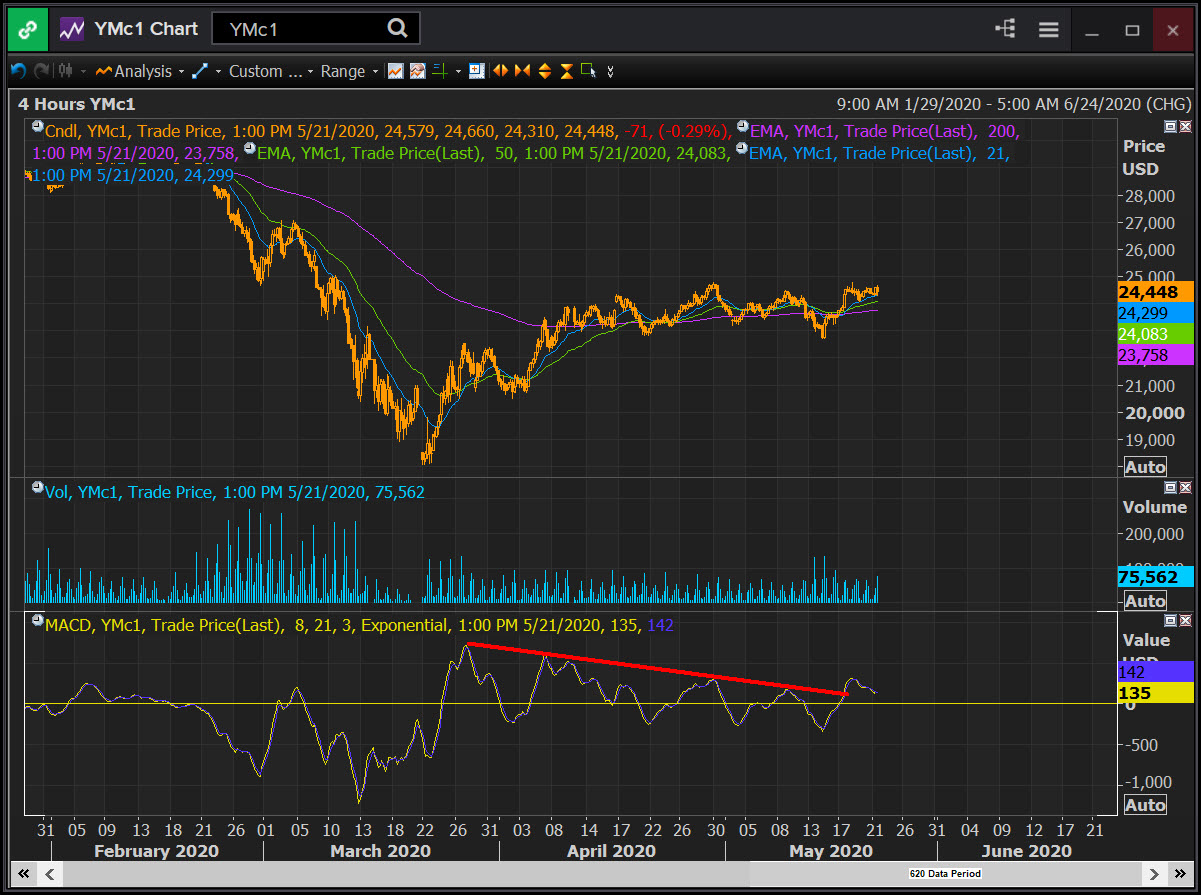
Likewise, the level of activity in the major Index futures contracts is, for the most part, contracting. Here are ES / E-Mini S&P 500 and NQ / E-Mini Nasdaq 100


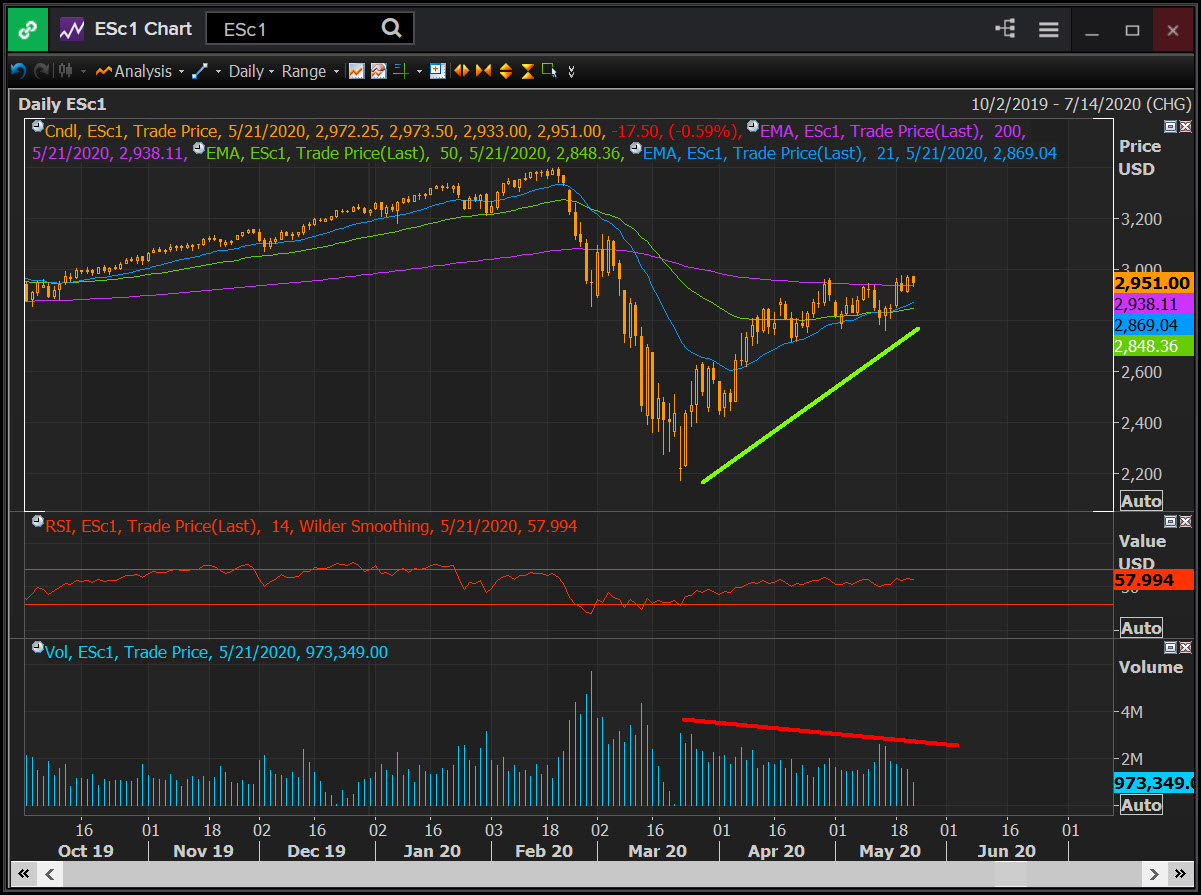
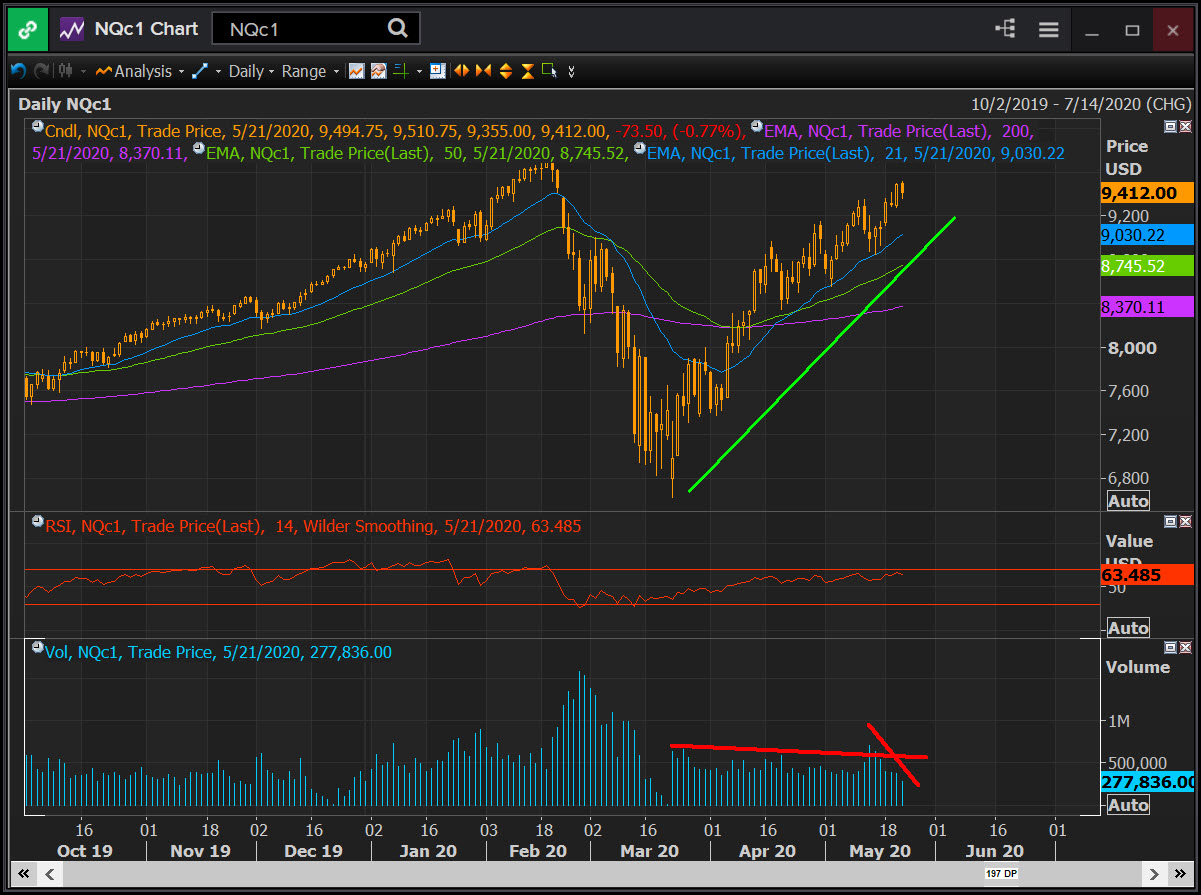
The peak upside momentum for the recovery has been recorded on April 14th for Nasdaq 100, April 7th for the SP500 and on March 26th for the Dow Industrials. Every successive price peak after those dates developed on declining upside momentum, a situation we would read as bearish.


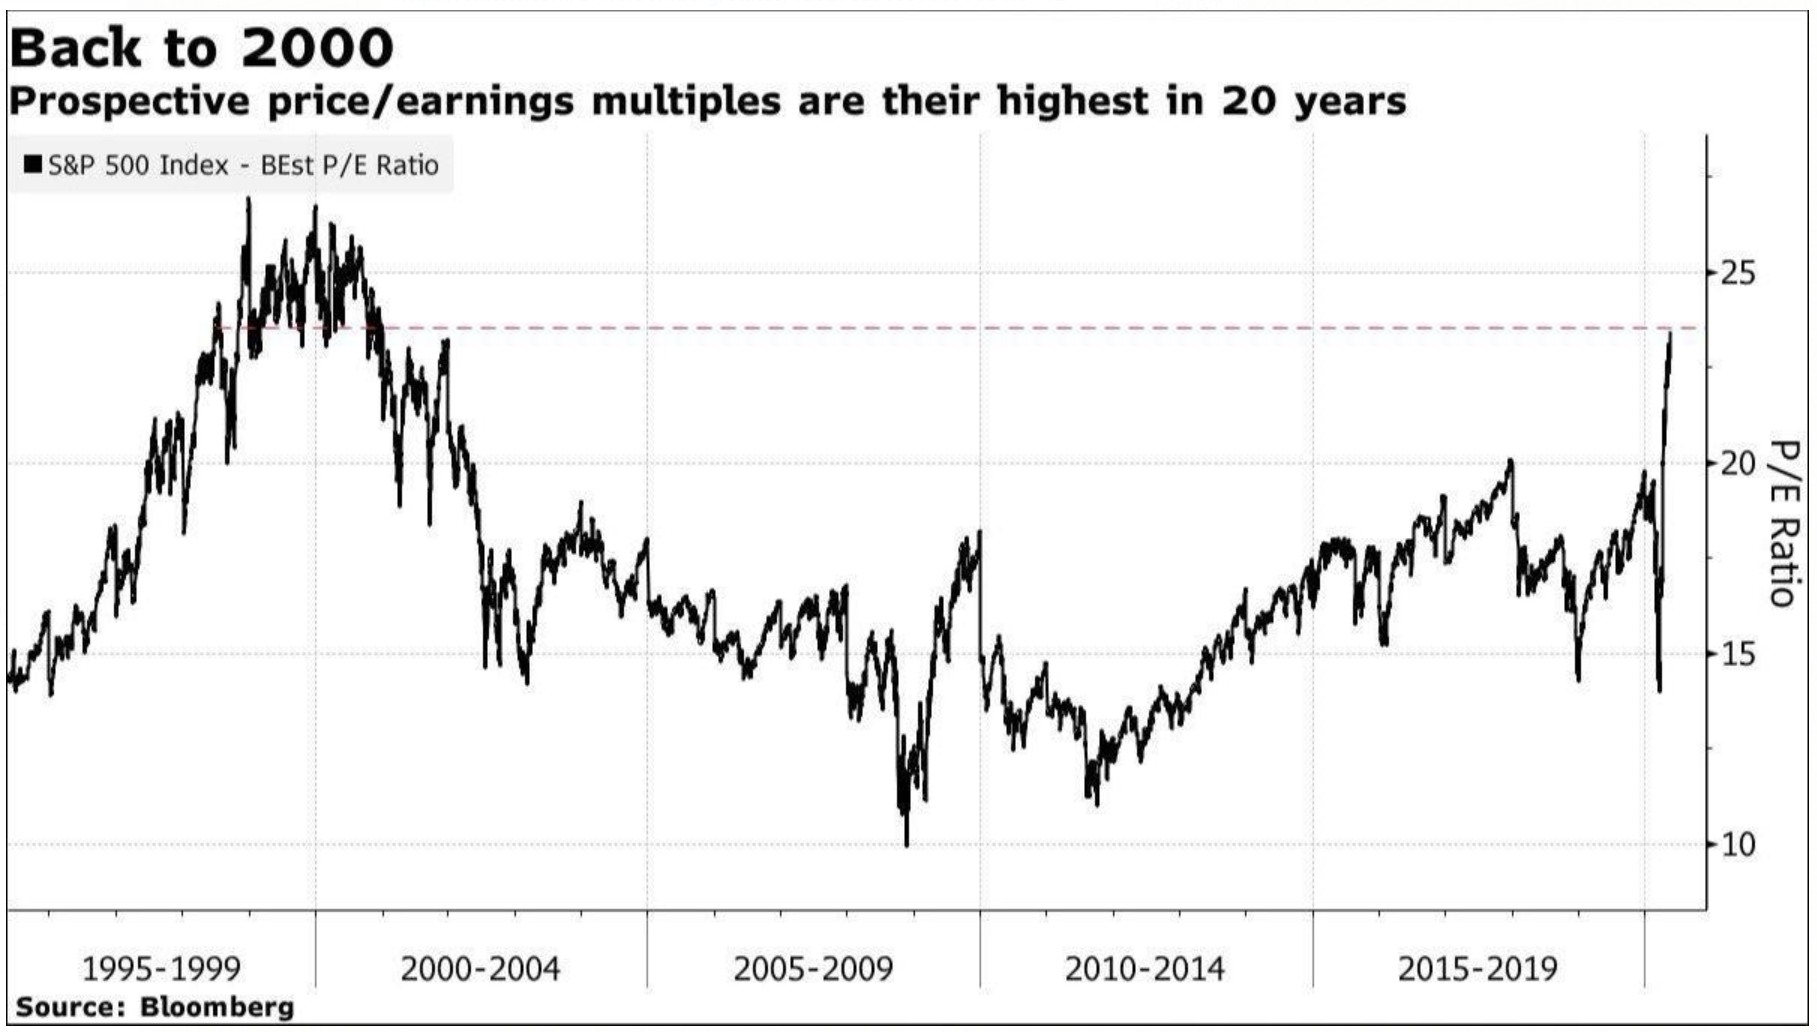
Valuation and sentiment, on the other hand have just gone off the chart. The sharp rebound – which as we have shown appears selective and as of late technically weak in terms of money flow and momentum – has led to some pretty outrageous valuation numbers:


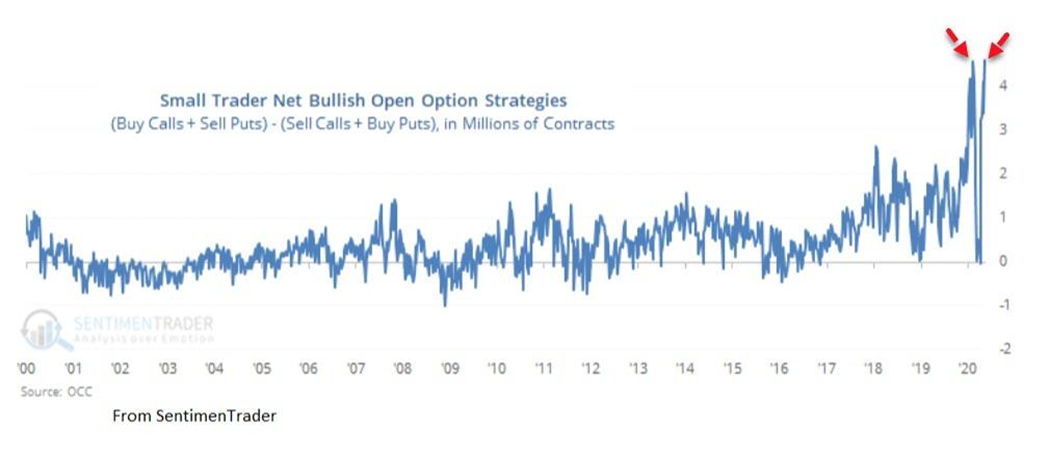
Meanwhile small trader bullish sentiment is going off the chart. Sentiment Trader reports that small trader net bullish open option strategies commitments are at a major extreme. These in essence are speculative bets small traders are making in highly leveraged fashion on the idea that the market will continue to rally. Generally, small traders are not the sharpest segment of the market so the fact that they just went all in placing aggressive option bets on a continuing market rally is a very powerful contrarian indicator. The sheer sense of urgency and the implicit FOMO – fear of missing out – attitude in the face of absurd valuation and deteriorating technicals can be viewed as nothing but the kind of one-sided psychology that generally develops near turning points.


In appreciating the current wave of enthusiasm and how ill placed it really is, you must recognize something else. Much of the risk appetite is fueled by the belief that the FED is going to be on the other side of every trade. This can be very easily proven false for corporate bond purchases but even the current pace of Treasury purchases seems to suggest that something else is happening.


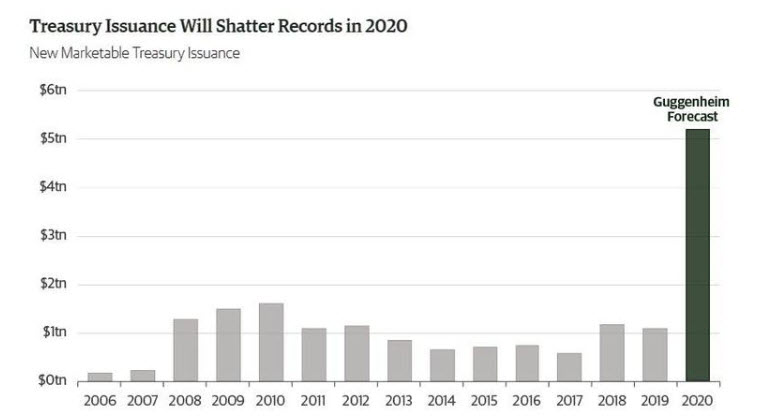
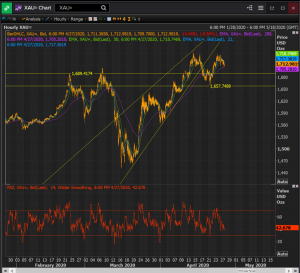
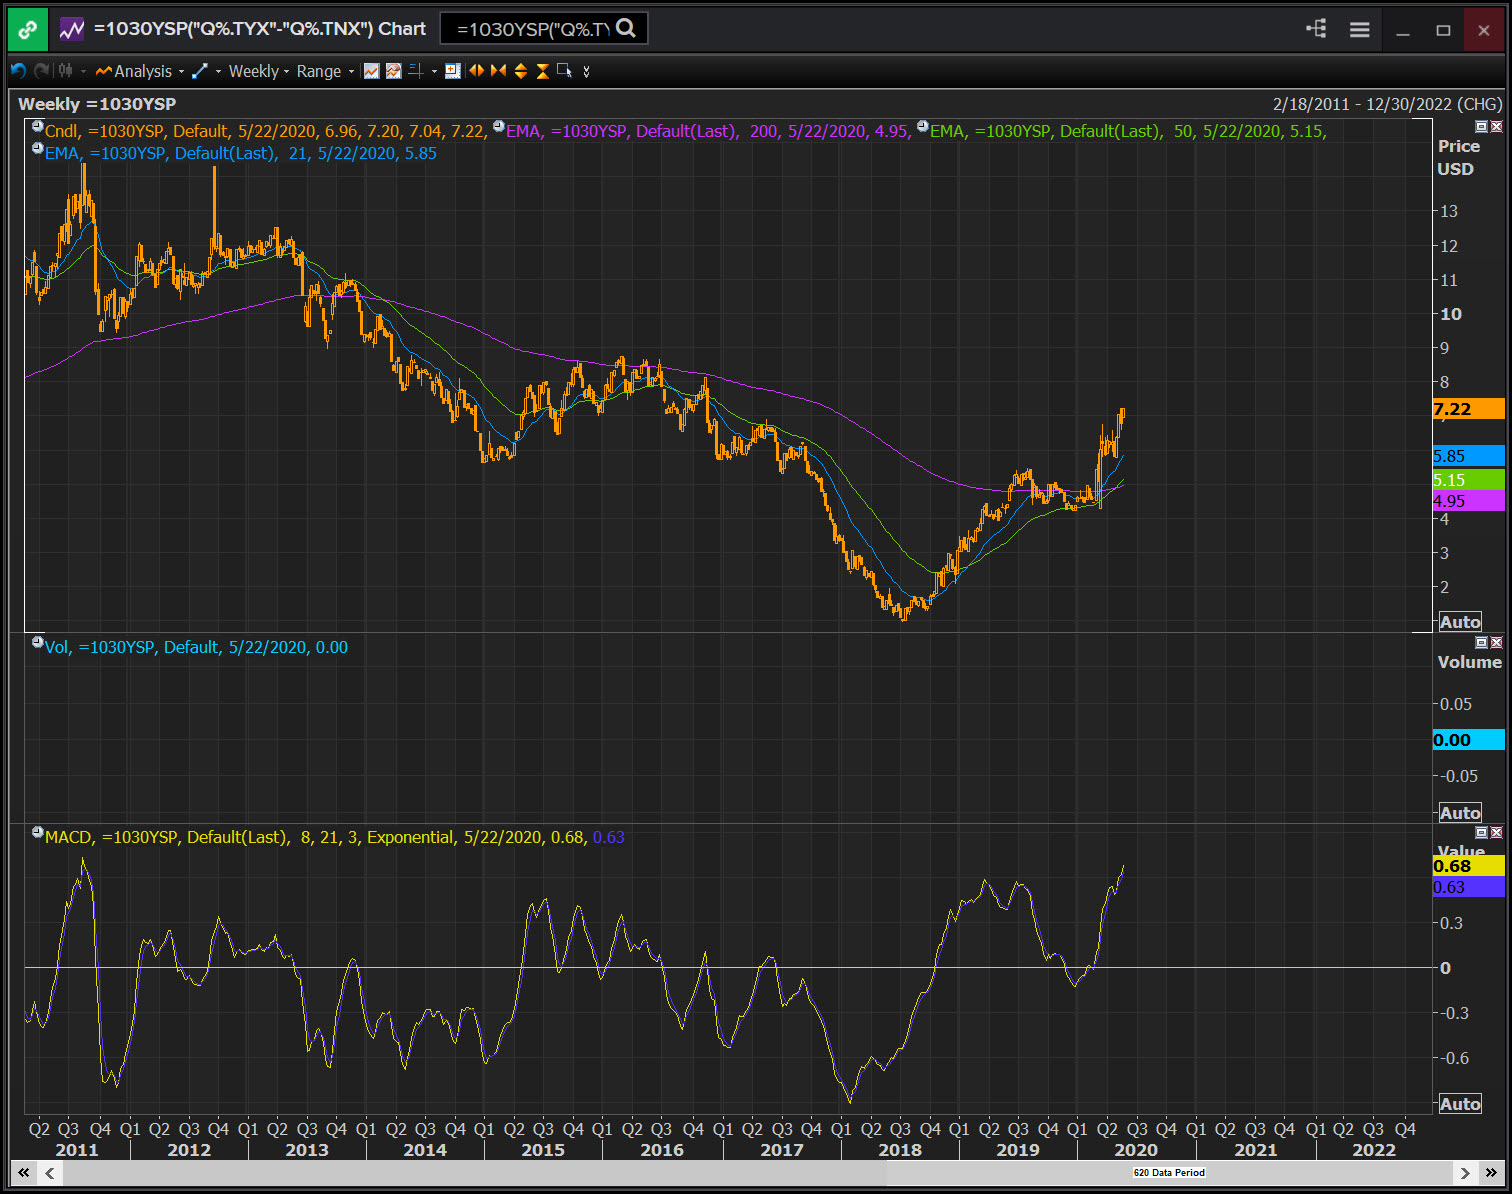
Guggenheim forecasts 2020 will shatter all and any previous records in terms of Treasuries issuance at just over 5 trillion dollars. In late March the FED was buying Treasuries to the tune of 75 billion a week which is roughly 4 trillion a year. That amount has now been reduced at 30 billion a week which is equivalent to approx. 1.5 trillion a year. The bond market, which as you know I keep reminding people is a strictly professional market and thus very smart, sophisticated and in the end very good for predictive purposes, senses possible issues with the financing gap. If the FED is buying only a portion of the Treasuries put up for sale, the rest becomes floating in the market and pressures yields higher. But the maturities where the FED buying is concentrated – 10 Year – would obviously see their yields more depressed due to the inverse relationship between bond prices and bond yields (increased FED purchases drives prices higher and yields lower). This mechanism has just lead to what we view as a major breakout to the upside in the 30 Year / 10 Year yield spread which in our opinion is a major issue for the precious metals market.


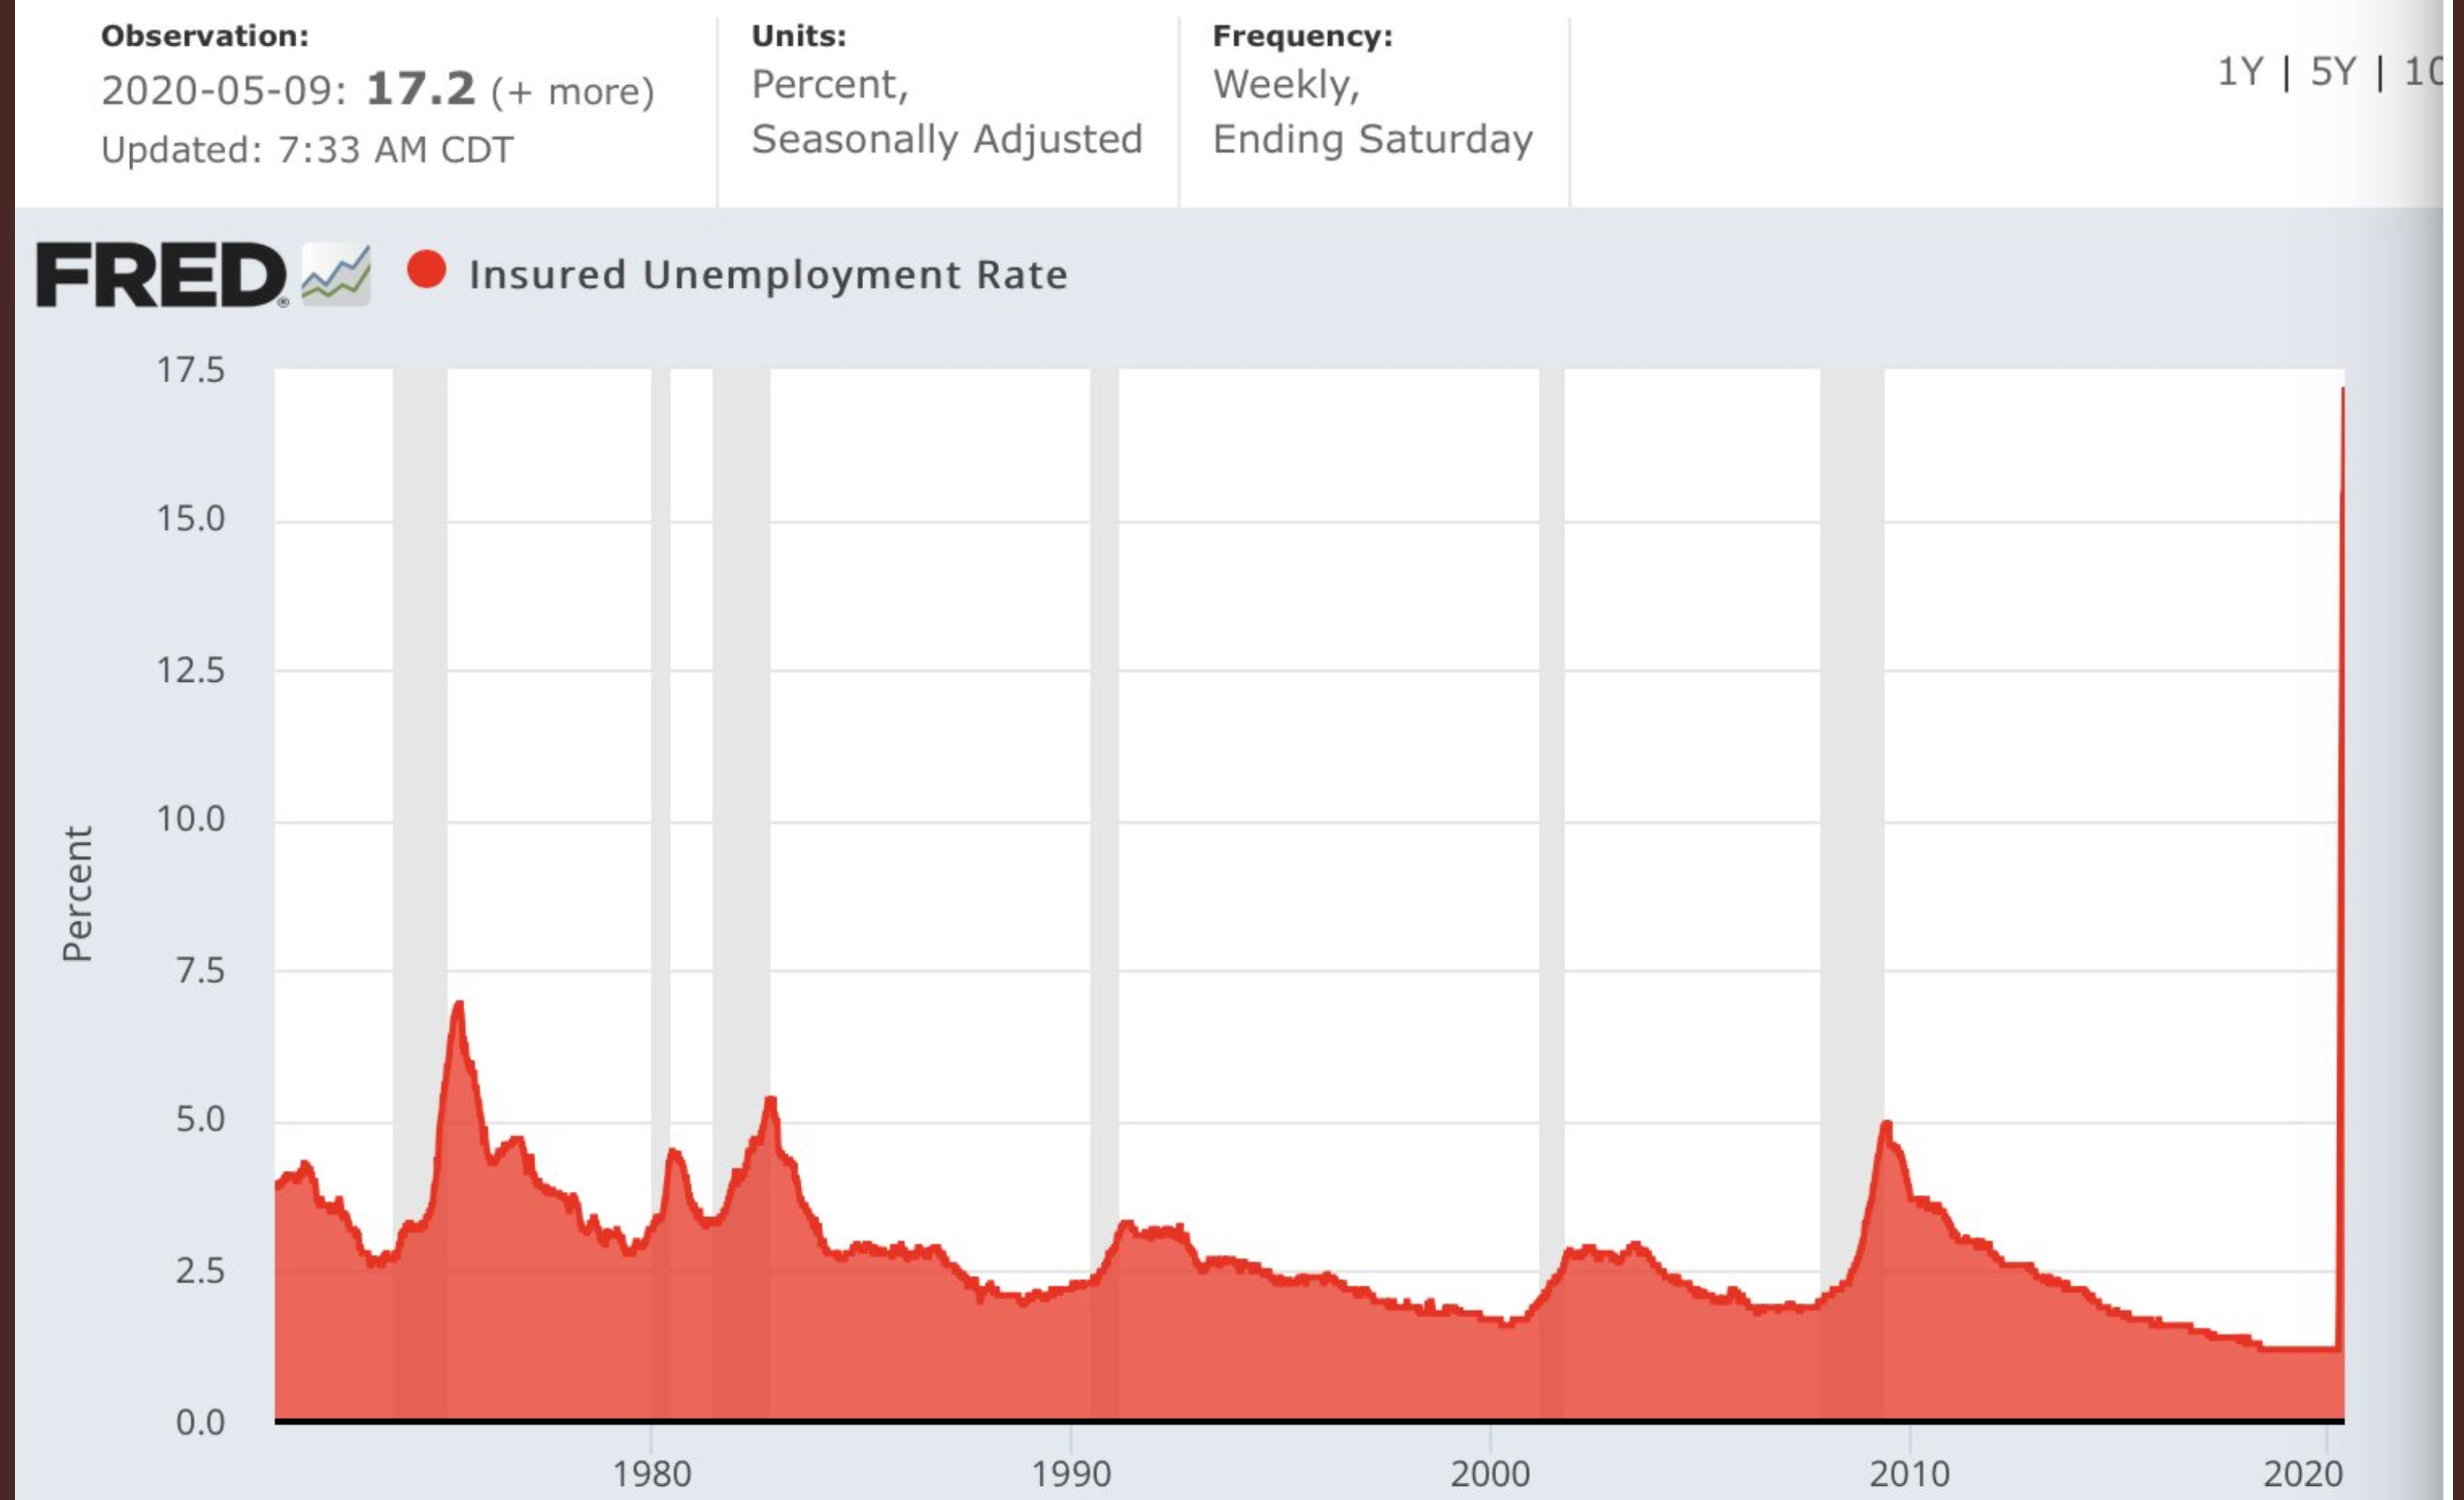
In our view the financing gap and the approaching wave of defaults given the record unemployment in the aftermath of the pandemic are major DEFLATIONARY not inflationary forces in the short run. Because of this we remain very unconvinced that stocks, bonds or metals purchases will do much if any good in the end. Our posture will remain defensive for now ……..

Read More

The decoupling

Correlation patterns at the asset class level stem from two sources, that is discounting factors and the way sectors and industry groups absorb higher or lower interest rates based on their respective impacts on earnings and company cost structures. Interest rates, on the other hand, result from a combination of perceived macro and micro credit risk and overall inflation expectations. Math essentially governs the first part through the time value of money; collective investor attitudes towards risk and return, largely patterned according to the Wave Principle, generally govern the second part. In general what tends to happen is that there is always a winner asset class, a loser asset class and a somewhere-in-between asset class. This is not what we currently see AT ALL and we believe it is reason for at least short-term concern.


A look at the 30 year yield chart above will reveal a few interesting things. First off, the rally from 83 bp to 1.942% is a bit leaner than the chop lower from 1.942% to 1.100%. The repel at the purple / longer moving average did lead to a cross over in the shorter MAs though not much follow through to the downside could be seen from that situation. Finally, the resistance line of the past month’s descent is much steeper than the corresponding support line of the same move. This suggests that for all the central bank intervention the bond market rally attempt isn’t the strongest. The yields are having difficulty moving any lower.

Meanwhile the SP 500 index appears engaged in a sluggish, technically selective push higher. The support line looks steeper than the resistance line, near-term momentum is overbought and the rise is for the most part supported by 5 stocks at this point. It begs the question, if the stock market isn’t yet on strong enough footing to rally in a more meaningful way, why are the bonds – as per the previous chart – looking vulnerable too?


Finally, a similar picture is to be seen in Gold. Here too support lines are steeper than resistance lines coming off the march lows. Here too near-term momentum appears a bit overdone; and here too initial tests of the longer average did not really lead to the meaningful, sustained advances above the shorter averages we’d normally get.


I am not going to bother anybody with our wave counts in SP500, bonds and metals because that may be a bit too technical. Needless to say, they’re all aligned suggesting the risk right now is both paper and hard asset vulnerability; this is compatible with the basic trend analysis explained above. Based on this, we aren’t convinced at all the moment of huge opportunity to deploy may have occurred a few weeks ago, in fact our stance right now is very defensive and we will require either substantially improved valuations, more friendly technicals or a combination of both before we commit to anything. Fundamentally, we believe it is largely under-appreciated how severe the next wave of defaults could end up being; and make no mistake about it, there is a limit to which all these things can end up on Central Bank balance sheets and not become systemic threats at the same time. To conclude, in the face of seemingly abnormal relationships between asset classes, we remain largely skeptical that the markets and the economy will have seen the entire amount of damage there is from the coronavirus crisis.

Read More

Shivers on the back ….

The wave principle is unique in the perspective it can give on market trends. Many technicians find themselves confused with Elliott and present as criticism the subjective nature of wave counts and how they must always be adjusted. It’s a fair point but it’s based on a practitioner flaw rather than an EWP flaw. The important thing to understand is that like any other technical tool, Elliott must not be used in isolation and must be combined with other elements of market behavior pertaining to flow, momentum, ratio, basic trend analysis, sentiment and related market confirmation. If this is done within the framework proposed by the wave personalities the results can be absolutely remarkable.


Much like the Elliott Wave Principle is an evolution of the Dow Theory, the wave personalities are a more detailed description of major trend phases. The difference really is a subtle one, in the sense that the Dow Theory’s major trend phases are distinguished in up versus downtrends – in other words the criteria here is trend direction; whereas the wave personalities are distinguished in motive versus corrective waves which can both unfold as either uptrends or downtrends – that is to say the criteria under the Wave Principle is wave function.


The Dow Theory’s third tenet suggests primary trends have three phases and they are slightly different from bull to bear markets. Rallies begin with disbelief, are dominated by trend follower interest in the middle and suck in the public at the end. Declines start with complacency, degenerate in concern in the middle portion and end with capitulation. The Dow Theory thus proposes opportunity arises somewhere where capitulation morphs into disbelief and it’s easy to see why that comes to be the case. Capitulation leads to an intense wave of selling that pushes assets to more attractive valuation levels. Also, capitulation is the final exhaust phase where everybody throws in the towel - so once it’s all done the selling pressure naturally dries up because there is nobody left to sell. The disbelief is the natural mental state of the market in the aftermath of a vicious wave of selling and is where the market is beginning to rebuild precisely because of the scars left by capitulation. Astute investors are enticed by great valuations – which creates buy flow - and the activity expands only on the rallies simply because of a complete disappearance of sellers. It makes total sense.


Elliott on the other hand proposes that opportunity arises during 2nd waves. Second waves are so called “retests of lows” and can be confirmed in two simple ways - they subdivide in a corrective a-b-c structure and do not carry to a new extreme (retracement is contained at 100% and in most cases 61.8-78.6% but sometimes 38.2-50% of wave 1). The fact that the 2nd wave doesn’t carry to a new low is a fundamental and very concrete change in market behavior because the sequence of lower highs and lower lows that will have defined the previous downtrend is now in the early stages of being broken. The inability to push to a new low despite the fact that psychology is often more extreme than at the actual market turning point and fundamentals look almost hopeless is the classical example of the market disregarding current negativity and discounting the more positive picture that will suddenly surface in the ensuing wave 3. As the say goes, the best news for a market is a market that doesn’t fall on bad news.


If you do a checklist of all these items and evaluate the current environment you will see that many things are lined up for a short-term reversal here. Calling for a bull market would be a different thing because rebuilding after black swan events takes time and frankly with this volatility and time compression, we just don’t have to do so to make a buck. Suffice is to say the negativity and the desperation we see in the news in the context of the currently prevailing technical picture IS NOT BEARISH. Consider this


  • Fear at the march low almost matched the levels reached in 2008;
  • The fear build up now took 3-4 weeks vs 9 months – this is an intense burst of sharply focused emotion;
  • The spike in volume suggests capitulation occurred – at least for now;
  • The recent rebound is largely technical and we can’t explain through fundamentals what the market seems to be doing but the immediate downtrend has been violated;
  • Activity seems to be drying up during declines;
  • The leg down from 2640 seems to have an a-b-c corrective form;
  • Previous structural levels and initial percentage retracement seem to prop the market up pretty well so far;
  • Everybody, including the media and the officials seem unable to see any hope despite the fact that tough containment measures have been instituted at this point. This is the exact opposite we had a month ago when everybody was complacent and nothing was being done against an accelerating breakout;


Bottom line: we may all have shivers on our backs but if you look on the chart below the technical evidence we see is a bit more balanced than that. In our portfolios we are now at our lowest cash position in months as we’ve deployed a bit near the low and a bit more in the past 48 hours. Let’s see what happens.


Read More